Observable Review (2026): Pricing, Features & Honest Verdict
TLDR
Observable is a reactive JavaScript notebook platform built by the creator of D3.js for data visualization and interactive storytelling. Best for: data journalists and visualization developers. Price: Free (5 notebooks) / $15/mo Pro. Rating: 7.4/10
What is Observable?
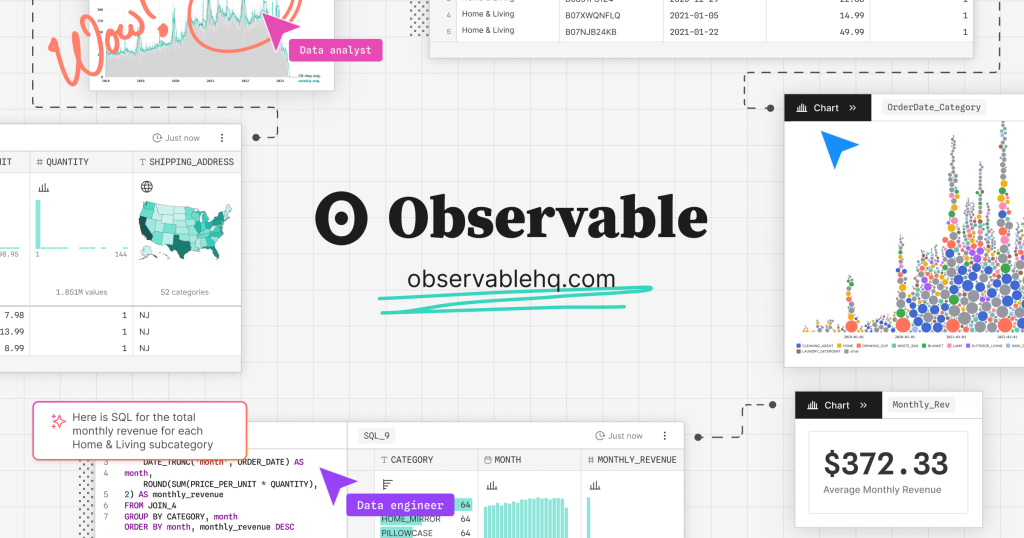
Observable is a browser-based notebook platform designed specifically for data visualization and exploratory analysis. Created by Mike Bostock (the person behind D3.js), it brings reactivity to data work: change a value and everything downstream updates instantly. Cells can contain JavaScript, SQL, HTML, or Markdown, and the results render inline as interactive charts, tables, and widgets.
Beyond notebooks, Observable offers Framework, a static site generator purpose-built for data dashboards. You write Markdown files with embedded JavaScript data loaders, and Framework compiles them into fast, deployable websites. This bridges the gap between exploratory analysis and production dashboards. The platform also includes Plot, a high-level charting library that makes common visualizations trivial, while still giving you full access to D3 when you need precise control.
Key Features
Reactive notebooks: Observable notebooks use dataflow programming. Each cell is a reactive expression that automatically re-evaluates when its dependencies change. This makes exploration fast and ensures visualizations always reflect the current state of your data.
Observable Plot: A concise, high-level charting library that handles 80% of common visualizations in a few lines of code. Line charts, bar charts, scatter plots, histograms, and heatmaps all work with minimal configuration. When you need more control, you can drop down to D3.
Observable Framework: A static site generator for data apps and dashboards. Write Markdown with JavaScript data loaders, and Framework builds a fast, static website. Data loaders run at build time in any language (Python, R, SQL, shell scripts), so your dashboard loads instantly for viewers.
SQL integration: Query databases and files directly in notebook cells using SQL. Observable connects to DuckDB, PostgreSQL, SQLite, and CSV/Parquet files. Results flow into JavaScript as arrays you can visualize immediately.
Collaboration and sharing: Notebooks can be shared publicly or within teams. The platform supports comments, version history, and forking. Published notebooks are interactive web pages that anyone can view and explore without an account.
Pricing
The free tier gives you 5 notebooks and access to the full platform including Plot and Framework. The Pro plan at $15 per month unlocks unlimited private notebooks, private database connections, and advanced collaboration features. Team plans are available for larger organizations. Observable Framework is completely free and open source regardless of plan.
Pros and Cons
Pros
- Best-in-class data visualization with Plot and native D3 integration
- Reactive execution model keeps visualizations in sync with data changes
- Framework SSG bridges the gap between analysis and production dashboards
- SQL cells work directly with databases and file formats
- Published notebooks are shareable, interactive web pages
Cons
- JavaScript-only limits adoption among Python-centric data teams
- Free tier restricted to just 5 notebooks
- Steeper learning curve than Python notebook alternatives
- Community is smaller than Jupyter or R Markdown ecosystems
| Plan | Price | Plan Features | Best For |
|---|---|---|---|
| Free | $0/mo | 5 notebooks, public sharing, Plot and Framework access | Individual exploration |
| Pro | $15/mo | Unlimited private notebooks, private DB connections, advanced collaboration | Professional analysts |
Who Should Use Observable?
Observable is built for people who work at the intersection of data and presentation. Data journalists, visualization engineers, and analysts who publish interactive reports will get the most value. If your workflow involves creating charts, dashboards, or data stories that need to be shared with others, Observable handles the full pipeline from exploration to publication. It is not ideal for teams that primarily work in Python or need heavy statistical computing, as the JavaScript requirement is a hard constraint.
Alternatives
Jupyter
The dominant notebook platform supporting Python, R, Julia, and dozens of other languages. Jupyter has a massive ecosystem but lacks reactivity and produces JSON files that are painful to version control. Choose Jupyter if you need multi-language support and maximum library compatibility.
Marimo
A reactive Python notebook that stores as pure .py files. Marimo solves similar problems to Observable (reactivity, clean state) but in the Python ecosystem. Choose Marimo if you want reactive notebooks but need to stay in Python.
Hex
A cloud-hosted data workspace combining SQL and Python with scheduling, sharing, and team collaboration. Hex is more enterprise-focused and comes at a higher price point. Choose Hex if you need a managed platform with strong team features and do not mind vendor lock-in.
FAQ
Do I need to know D3.js to use Observable?
No. Observable Plot handles most common charts with simple, declarative syntax. You only need D3 knowledge for highly custom visualizations. Most users never touch D3 directly.
Can I use Python with Observable?
Not directly in notebooks. However, Observable Framework supports data loaders written in any language, including Python. Your Python scripts run at build time and feed data into JavaScript visualizations.
Is Observable Framework the same as Observable notebooks?
No. Framework is a separate, open-source static site generator for building data dashboards. Notebooks are the browser-based interactive environment. They complement each other but serve different purposes.
Observable Pros & Cons
What We Like
- Best-in-class data visualization with Plot and D3
- Reactive execution keeps visualizations in sync
- Framework SSG bridges analysis to production dashboards
- SQL cells work with databases and file formats
- Published notebooks are shareable interactive web pages
What Could Be Better
- JavaScript-only limits Python-centric data teams
- Free tier restricted to 5 notebooks
- Steeper learning curve than Python alternatives
- Smaller community than Jupyter or R Markdown
Observable FAQ
Do I need to know D3.js to use Observable?
No. Observable Plot handles most common charts with simple syntax. You only need D3 for highly custom visualizations.
Can I use Python with Observable?
Not directly in notebooks, but Observable Framework supports Python data loaders that run at build time and feed data into JavaScript visualizations.
Is Observable Framework the same as Observable notebooks?
No. Framework is a separate open-source static site generator for dashboards. Notebooks are the browser-based interactive environment.
What is Observable?
Reactive JavaScript notebook platform by the creator of D3.js, built for data visualization with Plot, SQL integration, and a static site generator for dashboards.
How much does Observable cost?
Observable pricing starts at Free / $15/mo Pro. A free plan is available.
Is Observable worth it?
Observable is the best platform for JavaScript-based data visualization and interactive publishing. The combination of Plot, D3 access, and Framework makes it uniquely powerful for data storytelling. The JavaScript-only constraint limits its audience. We rate it 7.4/10.