Revenue Map Review (2026): Pricing, Features & Honest Verdict
TLDR
Revenue Map is an AI financial modeling tool that builds investor-ready startup projections from 12 industry templates, with Monte Carlo scenario analysis and one-click PDF reports. We found it turns the spreadsheet slog into a guided flow. Best for: early-stage founders who need a credible model fast. Price: from $29/mo, no free plan. Rating: 7.9/10.
What is Revenue Map?
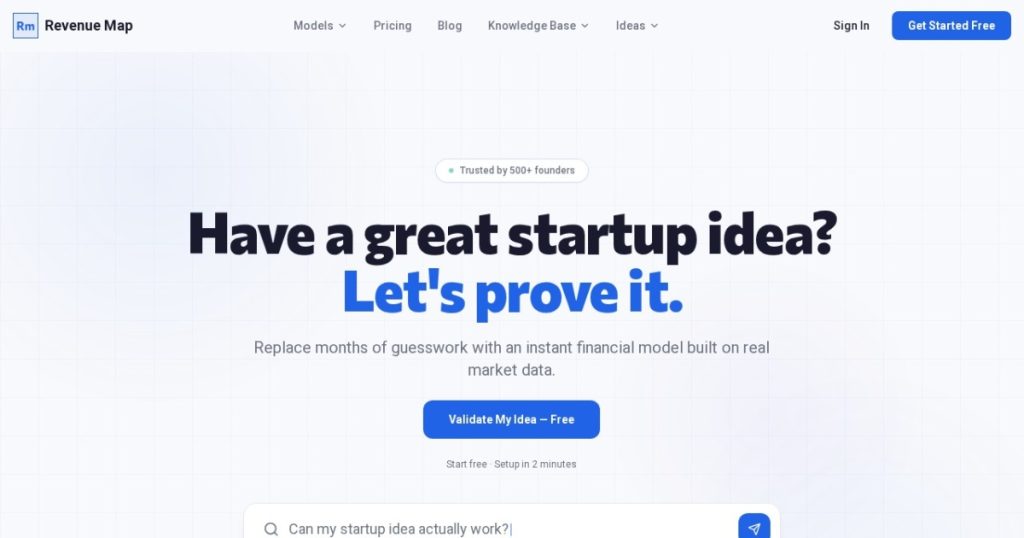
Revenue Map is a financial modeling platform built for founders who need projections but do not want to build them in Excel. You pick an industry model, answer questions about your business, and it generates revenue, cost, and profitability forecasts across your growth phases. The pitch is simple: get an investor-ready model without spending a week wrestling formulas or paying a fractional CFO to do it for you.
It is aimed squarely at early-stage founders validating an idea. Instead of a blank spreadsheet, you start from one of 12 purpose-built models for specific business types, including SaaS, ecommerce, AI and ML, marketplace, healthtech, and edtech. The models are based on real market data, so the assumptions baked in are not random. What matters in 2026 is timing: several of the dedicated startup-modeling tools founders used to reach for have been acquired and wound down, leaving a gap that Revenue Map is moving into at a much lower price point.
The deeper appeal is that it lowers the bar for who can produce a defensible model. Building one from scratch demands both spreadsheet fluency and an understanding of which drivers matter for your business type, and plenty of capable founders have neither. Revenue Map encodes that knowledge into the templates and the AI layer, so a non-finance founder can produce something a seed investor will take seriously. That is a meaningful shift, because a weak or hand-wavy model is one of the fastest ways to lose an investor’s confidence in a first meeting.
What Are Revenue Map’s Key Features?
12 industry-specific models
The starting point is a template, not a blank canvas. Revenue Map ships 12 models tailored to specific industries, so a SaaS founder gets MRR, churn, and CAC logic while an ecommerce founder gets order volume, AOV, and margin logic. Because each model is built around the metrics that actually drive its category, the projections are more credible out of the box than a generic three-statement template you fill in yourself.
Monte Carlo scenario analysis
This is the feature that separates Revenue Map from a fancy calculator. It runs Monte Carlo simulations across 1,000-plus scenarios and lets you compare pessimistic, base, and optimistic outcomes side by side. Rather than a single deterministic forecast, you get a range of likely results, which is exactly what a sharp investor will ask about. Most cheap modeling tools cannot do this; it is usually reserved for the expensive ones.
AI assistant and metric alerts
An AI assistant interprets your metrics, flags risks, and answers custom questions about your model in plain language. On top of that, metric alerts fire when key ratios drift from industry benchmarks, so you find out a number looks off before an investor does. On the Plus plan the AI is capped at 30 messages per project per month, while Pro removes the limit.
Investor reports and actuals tracking
Revenue Map produces one-click PDF reports with financial summaries you can drop into a data room or pitch. It also lets you track actual monthly performance against your projections, so the model stays useful after the raise, not just during it. That ongoing comparison is what turns a fundraising artifact into a planning tool.
How Much Does Revenue Map Cost?
Revenue Map starts at $29 per month on the Plus plan, or $23 per month if you pay annually. Plus gives you 3 projects, 3 scenarios per project for 9 total, sharing with up to 3 people, plus 30 AI messages and 3 reports per project per month. The Pro plan is $49 per month, or $39 per month annually, and removes the caps: unlimited projects, scenarios, AI messages, and reports, with sharing for up to 10 people. Enterprise is custom-priced and adds priority support, onboarding, and an SLA. Every paid plan comes with a 10-day free trial and no payment upfront.
The pricing is the strongest part of the story. Causal, the most capable scenario-modeling tool in the category, starts around $250 per month. Finmark, long the go-to for startup modeling, started at $50 per month, but its standalone product is being shut down in April 2026 after its acquisition. With the dedicated incumbents either far pricier or leaving the market, Revenue Map’s $29-$49/mo range looks like real value for a founder who needs Monte Carlo scenarios and investor reports without enterprise pricing.
The trade-off is the caps on the entry tier. If you are modeling more than two or three ideas, or you lean heavily on the AI assistant, you will hit the Plus limits quickly and need to jump to Pro at $49/mo. That is still cheap by category standards, but it is worth knowing the $29 price assumes light usage. Most solo founders working on a single startup will fit comfortably inside Plus during a fundraise; the people who outgrow it fast are serial founders, accelerators, or advisors juggling multiple models at once, and for them Pro’s unlimited projects is the obvious tier and still a bargain.
| Plan | Price | Plan Features | Best For |
|---|---|---|---|
| Plus | $29/mo ($23/mo annual) | 3 projects, 9 scenarios total, 30 AI messages + 3 reports per project, share with 3 | Founders validating one or two ideas |
| Pro | $49/mo ($39/mo annual) | Unlimited projects, scenarios, AI messages and reports, share with 10 | Active founders and small teams |
| Enterprise | Custom pricing | Custom limits, unlimited sharing, priority support, onboarding, SLA | Larger teams needing support and SLAs |
Who is Revenue Map Best For?
Use Revenue Map if you are an early-stage founder who needs an investor-ready model and does not have the time, spreadsheet skill, or budget to build one from scratch. It is a strong fit for solo founders and small teams validating a SaaS, ecommerce, or marketplace idea, and for anyone preparing for a pre-seed or seed raise who wants scenario ranges rather than a single flat forecast.
Skip Revenue Map if you need full FP&A: deep accounting integration, payroll-level cost modeling, consolidations, or board-grade financial statements. For that, a tool like Causal or a dedicated FP&A platform is the right call despite the price. Skip it too if you genuinely want a free option, because the only on-ramp here is a 10-day trial, after which it is $29/mo minimum.
Best Revenue Map Alternatives
Causal
Causal is the heavyweight. It offers the closest feature parity to the old startup-modeling tools for scenario analysis and is far more flexible for complex, custom models. The catch is price: it starts around $250 per month, roughly five times Revenue Map’s Pro plan, and it was acquired by Lucanet in 2024. Pick Causal if you need serious modeling depth and have the budget. Pick Revenue Map if you want most of the scenario value for a fraction of the cost.
Finmark
Finmark was the popular choice for startup financial planning, starting around $50 per month and rising with revenue. The problem is that its standalone product is being shut down in April 2026 following its acquisition. It is included here because so many founders still know it, but it is effectively leaving the market. Revenue Map is positioning itself to absorb exactly the founders Finmark is leaving behind.
A spreadsheet template
The honest free alternative is a good Excel or Google Sheets template. It costs nothing and gives you total control, and for a simple model it can be enough. The downside is that you own every formula, you get no Monte Carlo simulation, no AI assistant, and no one-click investor PDF, and a single broken reference can quietly wreck your numbers. Choose a template if you have the time and the financial chops. Choose Revenue Map if you would rather buy back that time.
Final Verdict: Is Revenue Map Worth It?
Revenue Map does the thing most founders dread, building a financial model, and makes it fast, guided, and surprisingly credible. The 12 industry templates mean you start with the right metrics, the Monte Carlo scenario analysis gives you the ranges investors expect, and the one-click reports save real time when a raise is moving. Pricing it at $29-$49/mo while Causal sits at $250 and Finmark exits the market is shrewd, and it is the main reason to take Revenue Map seriously.
It earns its 7.9 for nailing the early-stage use case at a price that is genuinely hard to argue with. The marks against it are the lack of a free plan, the tight Plus-tier caps, and the fact that it is a modeling tool, not a full FP&A platform, so it will not grow with you forever. For a founder who needs an investor-ready model this quarter without learning Excel or hiring a CFO, Revenue Map is well worth the trial and, for most, the subscription. Run the 10-day trial against your real numbers before a fundraise, and you will know within an evening whether it saves you the week you would otherwise lose to a spreadsheet.
Revenue Map Pros & Cons
What We Like
- 12 industry-specific models so you start from a relevant template, not a blank sheet
- Real Monte Carlo scenario analysis with 1,000+ simulations
- One-click investor-ready PDF reports
- Far cheaper than Causal or Finmark, starting at $29/mo
What Could Be Better
- No free plan, only a 10-day trial
- The Plus tier caps you at 3 projects and 30 AI messages per project per month
- Built for early-stage modeling, not full FP&A or accounting integration
Revenue Map FAQ
What is Revenue Map?
Revenue Map is an AI financial modeling platform for founders. It generates investor-ready revenue, cost, and profitability projections from 12 industry-specific templates, runs Monte Carlo scenario analysis, and produces one-click PDF reports, replacing manual spreadsheet modeling.
How much does Revenue Map cost?
Plus is $29 per month, or $23 per month billed annually. Pro is $49 per month, or $39 per month billed annually. Enterprise is custom-priced. All paid plans include a 10-day free trial with no payment upfront.
Is Revenue Map worth it?
For an early-stage founder who needs a credible financial model fast, yes. At $29-$49/mo it costs a fraction of Causal or the discontinued Finmark and removes the spreadsheet pain. It is less worth it if you need full FP&A, accounting integration, or board-grade reporting.
What are the best Revenue Map alternatives?
Causal is the powerful but pricey scenario-modeling leader from $250/mo, Finmark was the popular startup option but its standalone product shuts down April 2026, and a spreadsheet template is the free fallback if you have the time and skill.
Does Revenue Map offer a free plan?
No. Revenue Map does not have a permanent free plan. It offers a 10-day free trial with no payment required upfront, after which the Plus plan is $29 per month.
Who is Revenue Map best for?
Revenue Map is best for early-stage founders and solo entrepreneurs validating a startup idea who need investor-ready projections quickly, without building models in Excel or hiring a fractional CFO.